PROJECT STUDY
Asset Health Monitor
Catch the fault while it is still a trend.
Predictive maintenance for process plants: regime-aware early warnings, sensor faults kept apart from machine faults, and remaining useful life shown as a range.
Explore the build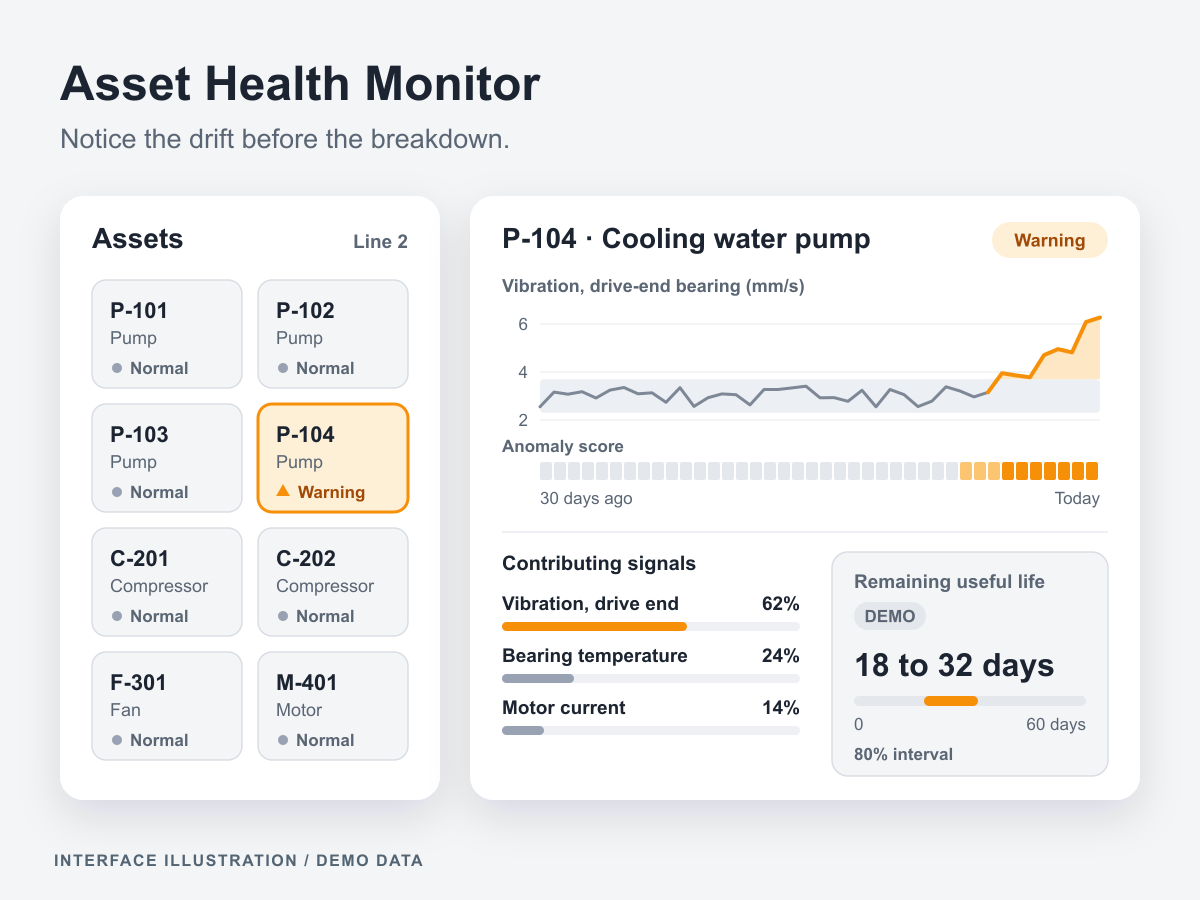
At a glance
- Industry
- Manufacturing
- Capabilities
- 7
- Technologies
- 11
- Year
- 2026
The challenge
Process plants run hundreds of rotating assets watched by thousands of sensors, and unplanned downtime is expensive.
Fertiliser and cement plants, palm-oil mills and power stations all depend on pumps, compressors and fans that degrade slowly before they fail.
Fixed alarm limits either fire constantly or too late, and a drifting or stuck sensor can look like a failing bearing. Maintenance teams need early, explainable warnings per asset, an estimate of how long a degrading asset can keep running, and a loop that learns from what technicians find.
What we built
Asset Health Monitor turns plant telemetry into early, explainable warnings, with a Python analytics pipeline, a FastAPI service and a React dashboard for reliability teams.
Telemetry ingestion
A batch HTTP endpoint and an asyncio streaming consumer write vibration, temperature, current, pressure and flow readings to time-partitioned DuckDB and Parquet storage
Sensor health kept apart
Data-quality rules catch stuck values, flatlines, drift and spikes, so a faulty instrument is flagged as a sensor issue and does not page a mechanic
Regime-aware anomaly detection
Operating regimes are found by clustering on load features, and normal behaviour is learned per asset and per regime. An Isolation Forest and a reconstruction model score every window against automatic per-asset thresholds
Explainable alerts with feedback
Contribution scores show which signals drove each anomaly. Alerts carry a severity, open and clear with hysteresis, are de-duplicated per asset and close with the technician's verdict of confirmed fault or false alarm
Remaining useful life as a range
A health indicator per asset feeds an exponential degradation fit with bootstrap uncertainty, which gives a distribution of remaining life to a failure threshold
Plant overview and asset detail
A health grid for the whole plant, asset pages with signals, anomaly score, regime shading and contributing signals, an alert inbox and a remaining-life chart with an uncertainty band
Fault-injection simulator and evaluation
A simulated plant of pumps, compressors and fans produces regime-dependent signals with injected machine faults, sensor faults and run-to-failure trajectories. An evaluation report measures event-based precision, recall, detection lead time, false alarms per asset-day and sensor-fault rejection against the injected faults
Telemetry ingestion
A batch HTTP endpoint and an asyncio streaming consumer write vibration, temperature, current, pressure and flow readings to time-partitioned DuckDB and Parquet storage
Sensor health kept apart
Data-quality rules catch stuck values, flatlines, drift and spikes, so a faulty instrument is flagged as a sensor issue and does not page a mechanic
Regime-aware anomaly detection
Operating regimes are found by clustering on load features, and normal behaviour is learned per asset and per regime. An Isolation Forest and a reconstruction model score every window against automatic per-asset thresholds
Explainable alerts with feedback
Contribution scores show which signals drove each anomaly. Alerts carry a severity, open and clear with hysteresis, are de-duplicated per asset and close with the technician's verdict of confirmed fault or false alarm
Remaining useful life as a range
A health indicator per asset feeds an exponential degradation fit with bootstrap uncertainty, which gives a distribution of remaining life to a failure threshold
Plant overview and asset detail
A health grid for the whole plant, asset pages with signals, anomaly score, regime shading and contributing signals, an alert inbox and a remaining-life chart with an uncertainty band
Fault-injection simulator and evaluation
A simulated plant of pumps, compressors and fans produces regime-dependent signals with injected machine faults, sensor faults and run-to-failure trajectories. An evaluation report measures event-based precision, recall, detection lead time, false alarms per asset-day and sensor-fault rejection against the injected faults
How it works
Ingest and check sensors
Readings arrive in batches over HTTP or through the asyncio streaming consumer and land in time-partitioned DuckDB and Parquet storage. Sensor-health rules check every signal, so a stuck, flatlined, drifting or spiking reading is flagged as an instrument issue instead of an asset fault.
Learn normal per regime
Windowed features are computed per asset, and clustering on load features assigns each window to an operating regime. Normal behaviour is learned per asset and per regime, so a load change or a start-up is not mistaken for wear.
Score against learned limits
An Isolation Forest and a reconstruction model score each window. Each asset's alert threshold comes from a peaks-over-threshold fit at a target false-alarm rate, and contribution scores record which signals pushed the score up.
Alert, review and learn
Alerts open and clear with hysteresis, merge per asset and carry a severity. Technicians acknowledge and resolve them in the alert inbox and mark each one as a confirmed fault or a false alarm, and that feedback is tracked as precision over time.
Estimate remaining life
When an asset's health indicator degrades, an exponential degradation fit with bootstrap resampling gives a distribution of remaining life to a failure threshold. The asset page draws it as a chart with an uncertainty band.
Engineering insights
A warning is only useful when the reliability team trusts it, so every stage is built to avoid the false alarms that make fixed limits easy to ignore.
Stack by layer
- Frontend
- React
- TypeScript
- Vite
- Backend
- Python
- FastAPI
- Pydantic
- asyncio
- Data
- DuckDB
- Apache Parquet
- AI
- scikit-learn
- Isolation Forest
- Peaks-over-threshold
- NumPy
- Infrastructure
- uv
- pytest
- Ruff
- Biome
A stuck sensor never pages a mechanic
Sensor health and asset health are separate checks: stuck values, flatlines, drift and spikes are caught by data-quality rules and reported as instrument issues, so a bad reading is not reported as a failing machine
Normal depends on the operating regime
Start-ups, shutdowns and load changes move vibration, temperature and current more than early wear does. Clustering windows on load features first means each window is judged against the same asset in the same regime
Two detectors with different blind spots
An Isolation Forest flags windows that are rare in feature space, while a reconstruction model flags readings that are each normal on their own but break their usual relationships. Contribution scores then name the signals behind each anomaly
Alert limits from extreme value theory
Instead of hand-set limits, the peaks-over-threshold method fits a generalised Pareto distribution to the upper tail of each asset's anomaly scores and places the threshold at a target false-alarm rate. Hysteresis and per-asset de-duplication keep one developing fault from becoming a stream of repeated alerts
Remaining life as a range, not a date
An exponential degradation fit with bootstrap resampling turns the crossing of a failure threshold into a distribution instead of one falsely precise number. The method is scored on simulated run-to-failure trajectories with RMSE and prognostic horizon
Design system
Industrial clarity follows the high-performance HMI approach associated with ANSI/ISA-101: neutral grey surfaces keep a healthy plant visually quiet and colour is reserved for abnormal states, so the few assets that need attention stand out.
Colour palette
- Plant grey
#f4f5f7Page background, so a healthy plant stays visually quiet - Surface
#ffffffCards and panels - Line
#d9dde3Borders, dividers and hairlines - Ink
#1b2430Text and live values - Muted slate
#5b6675Labels, units and secondary text - Alarm red
#d92d20Alarms, the highest-priority abnormal state - Warning amber
#f79009Warnings for developing anomalies - Advisory blue
#2e90faAdvisory notices
Colour
Plant grey backgrounds, white surfaces, hairline borders and ink text carry normal operation. Alarm red, warning amber and advisory blue appear only when something is abnormal
Typography
Inter with tabular numerals, so live values, anomaly scores and remaining-life ranges line up in columns and keep their width as they update
Layout
A compact, sparkline-first layout fits many assets on one screen and leads with each signal's recent trend
Components
A plant health grid, signal charts with regime shading, contribution bars, an alert inbox with feedback actions and a remaining-life chart with an uncertainty band
Where this fits
Plants with critical rotating equipment can apply the same pattern: trustworthy sensor data first, baselines learned per operating regime and warnings a technician can confirm. Explore our AI solutions, analytics dashboards and manufacturing work, or talk to us about your assets.
KEEP EXPLORING
Another problem. A different approach.
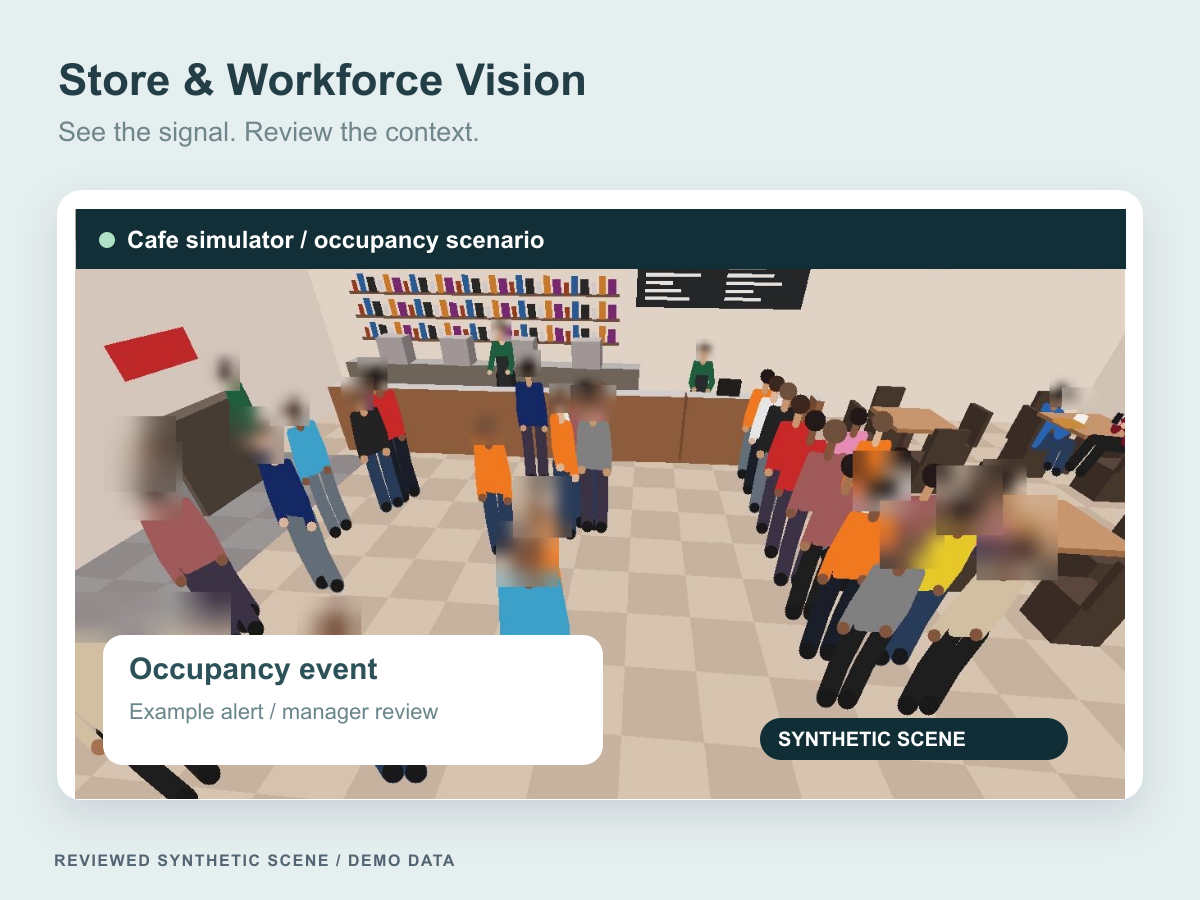
Store & Workforce Vision
A privacy-aware store operations platform for occupancy, queue and zone events, with configurable alerts, manager review and aggregate reporting.
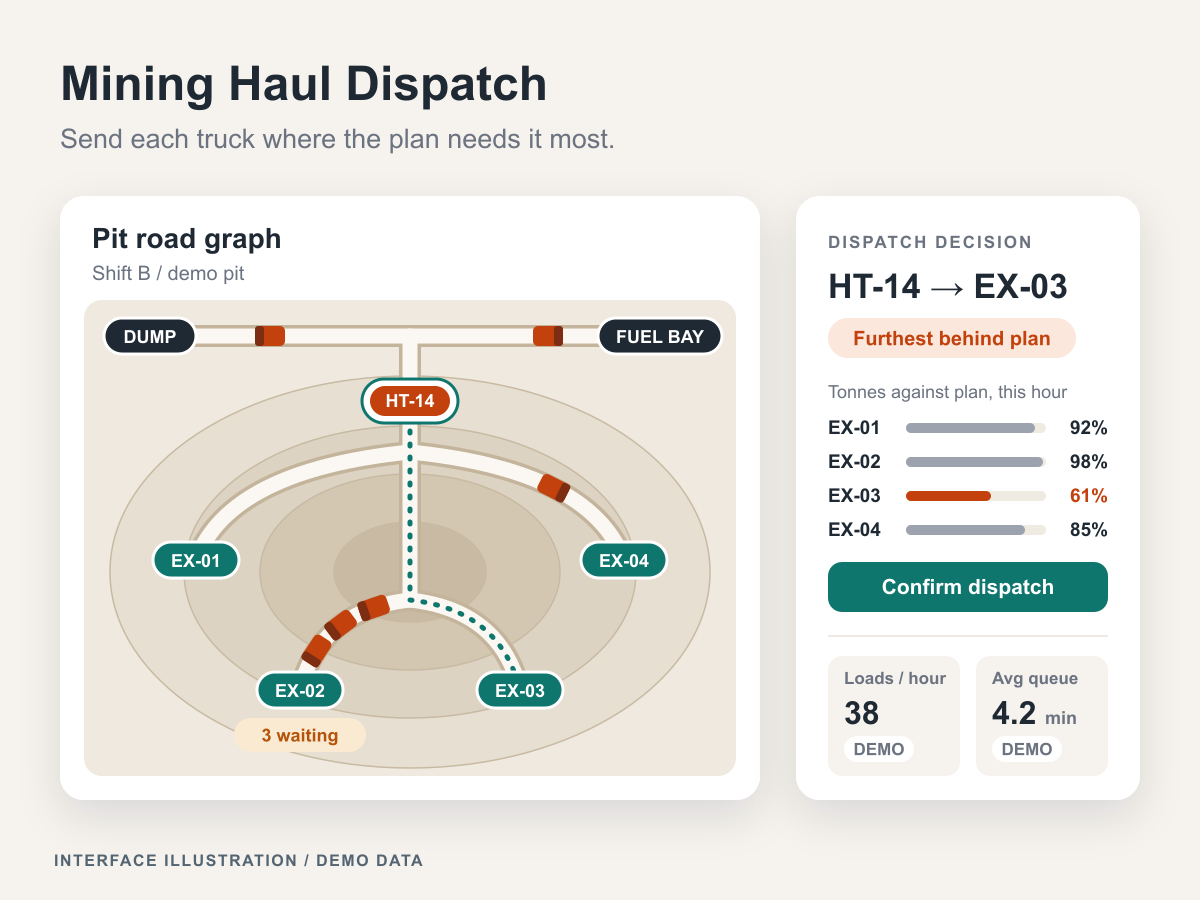
Mining Haul Dispatch
Haul dispatch for open-pit mines: a linear program plans haul flows inside the coal-quality band, and each truck goes to the excavator furthest behind plan, with the reason logged.
Let’s connect the dots
Let's put these ideas to work.
Share a process, product, or problem you want to improve. We will work through the possibilities together.